
History doesn’t repeat itself, but it often Rhymes.
Mark TwainA deadly global pandemic that kills 100,000 Americans, mass protests across the country against racial inequality, and a rising stock market. While that might sound like 2020, I'm actually talking about 1968.
In an effort to understand why the stock market keeps moving higher in the face of a steady drip of horrific news, it's helpful to look back at history.
In 1968, the H3N2 influenza pandemic spread across the globe, killing an estimated 100,000 Americans and 1 million people globally.
In 1968, following the assassination of Martin Luther King Jr. on April 4, protests against racial inequality spread across the country, with riots breaking out in 100 cities, leaving 39 dead and more than 2,000 injured.
Add into the mix the assassination of Robert F Kennedy and an escalation in the Vietnam War, and 1968 was a tough year all around.
And yet despite all of the negative headlines that year, stocks shrugged off the steady drip of bad news and moved higher.
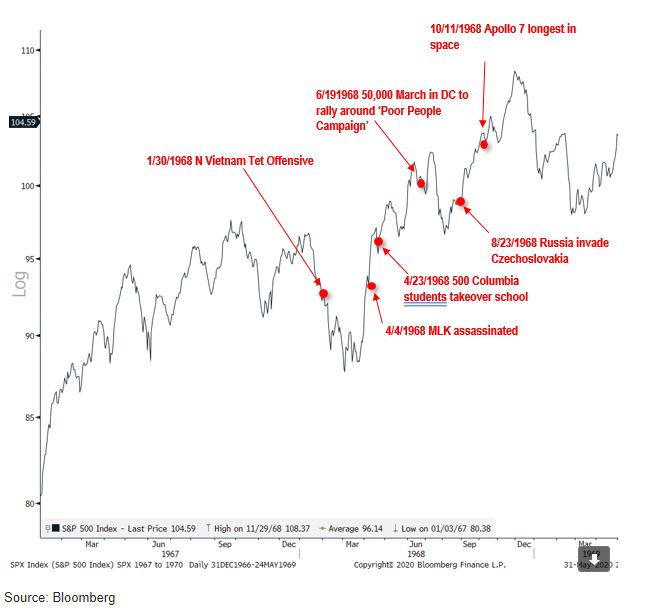
The S&P 500 posted a total return of 10.8% in 1968, above the historical average annual return of 8%.
Fast forward to 2020, and the S&P 500 has rallied 40% off its March 23 low and is down just 4% year-to-date. Meanwhile, the tech heavy NASDAQ 100 is up 11% year-to-date.
In that time, more than 40 million Americans have filed for unemployment, ~100,000 Americans died from COVID-19, and protests broke out across the country following the death of George Floyd by the Minneapolis Police Department.
The takeaway? Don't make investment decisions based on the news of the day, because often the market will do the opposite of what you expect it to do.
Instead, you should make investment decisions solely based on life events and your personal financial situation.
Finally, here's one more thing 1968 and 2020 share in common: A Presidential election.
Historically, stocks perform well in Presidential election years, with seasonality data showing a strong surge in stocks over the summer months.
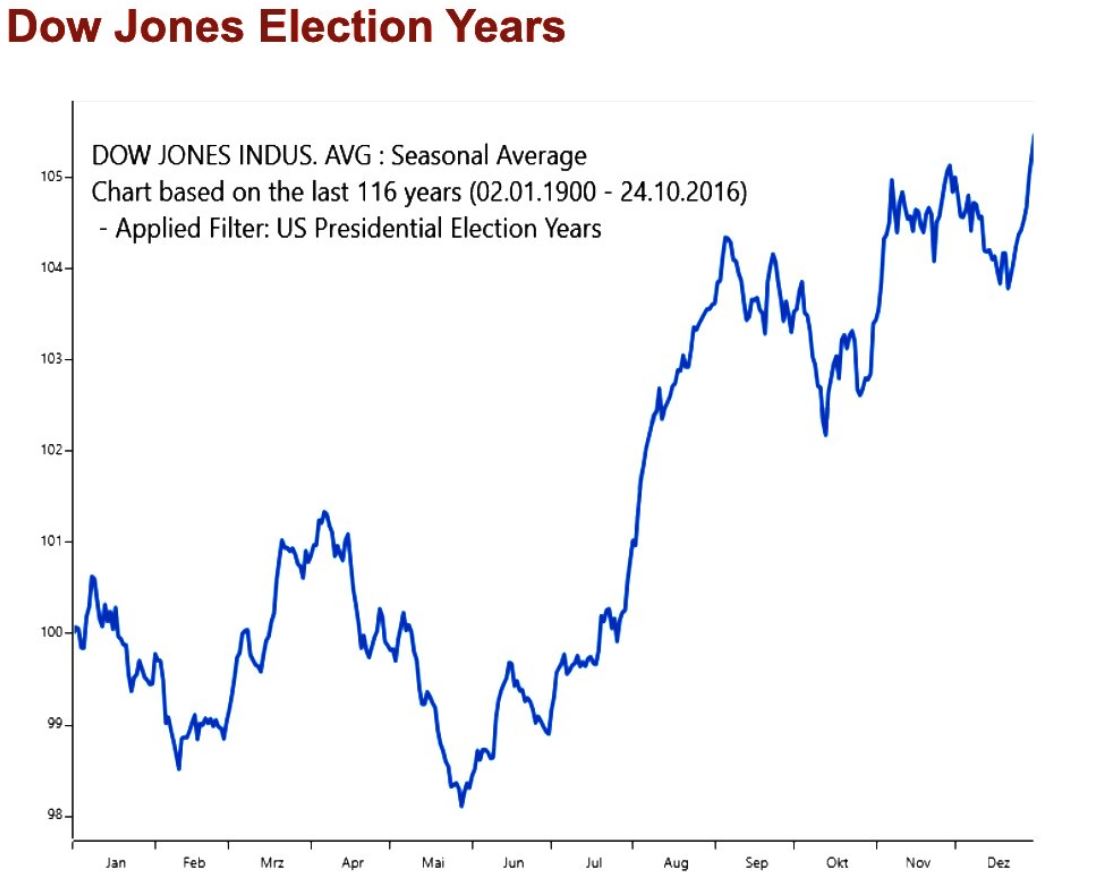
And since 1950, stocks have gone up every single year a President was up for re-election.
Historical trends can always be broken, but until that happens, they're trends worth following.
Rattled by today's headlines?
Let's talk it through — a relaxed, 20-minute conversation, no pressure.
Book a conversation